Executive Summary
The Kyabakari Gold Mine, located in the Mara Region of Tanzania, is located in the Musoma-Mara Greenstone Belt, an area known for its significant gold reserves, including the Mara North Gold Mine. The project has a robust orebody with total mineral resources of approximately 1 million ounces of gold (366 cusecs in indicated grade and 591 cusecs in inferred grade).
The mine is currently an active open pit operation owned by CATA Mining Company (CATA). The mine dates back to the 1950s and has previously been explored and mined by major companies such as AngloGold Ashanti, Placer Dome and Randgold Resources. CATA acquired the mine in 2016 and has since made significant progress, including drilling plans between 2020-2022 to update the resource model.
The updated mineral resource estimate, based on recent exploration data and JORC compliant standards, has resulted in the resource being classified as 366 Koz of gold in the Indicated category and 600 Koz in the Inferred category. This estimate, effective from 1 September 2022, reflects a combination of reliable historical data and recent exploration results.
Background
The Kibakari mining operation is located in northern Tanzania, East Africa, centered at 1°47'S, 33°50'E. The mine uses the UTM Arc 1960 coordinate system for all location and collar information.
The nearest major town to the mine is Musoma, which is the regional centre and capital of the Mara region. A tarmac road provides direct access to the mine site, which is located about 40 km south of Musoma. The nearest serviceable airport to the mine is at Musoma with occasional flights from Dar es Salaam and Mwanza. However, Mwanza, 150 km southwest of the mine, is a major regional air hub with several daily flights to Dar es Salaam and Nairobi in Kenya.
Water is supplied from local wells or from the Mara River, and electricity is supplied via a direct overhead line from Musoma to Kibakari village.
The climate is humid tropical with alternating wet and dry seasons. The main rainy season occurs between November and May with an average annual rainfall of about 1300 mm. The local topography is hilly, reflecting the resistant nature of the underlying greenstone belt lithologies, which form a series of roughly east-west outcrops that slope towards Lake Victoria in the west.
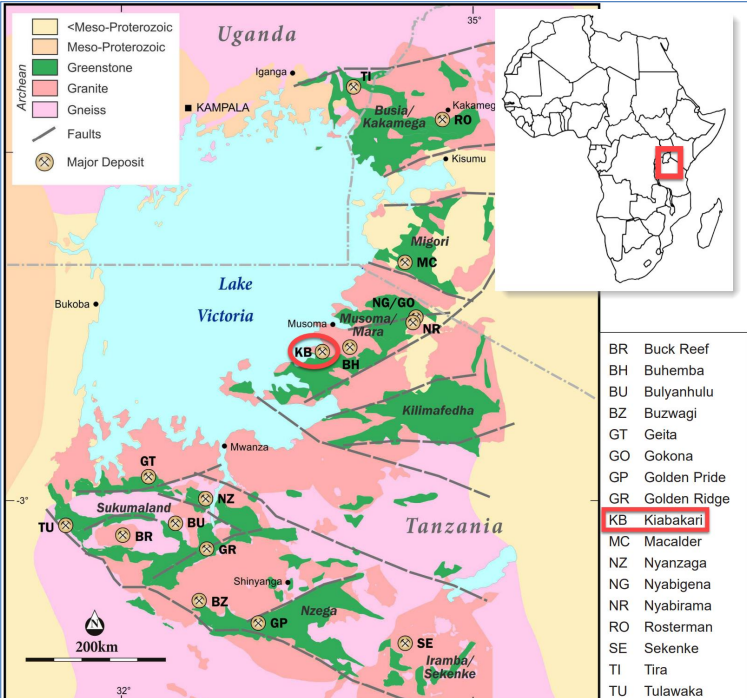 General location of the Kibakari mine in northern Tanzania and its relationship to regional geology and gold mining projects.
History
The Kibakari deposit was discovered in 1893 with the first claim made in 1933. A stamping plant was set up in 1935 and from that time until 1940 over 20 kilograms of oxide ore were mined, producing approximately 3,000 ounces of gold.
Production at the Kibakari mine ceased during World War II and no activity was recorded until 1950 when the Colonial Development Company began a diamond drilling campaign which identified a large deposit of disseminated gold. In 1953, Tengold Mining Company Limited was formed to commence mining, with underground operations in 1959 at a rate of 20,000 tonnes per month. Between 1955 and 1966, both open pit mining and extensive underground mining were carried out to target low-grade, high-tonnage minerals. By the time operations ceased in 1966, the mine had produced 283,000 ounces of gold at an average grade of 6.7 grams per tonne.
In the following decades, major mining companies such as Anglogold, Placer Dome and Randgold Resources carried out further appraisal and exploration activities, including drilling and geophysical surveys. Underground mining reached a depth of 350 metres, with additional development to 470 metres, although no mining occurred below 350 metres. The underground operations are now flooded and only opencast mining is active at the site.
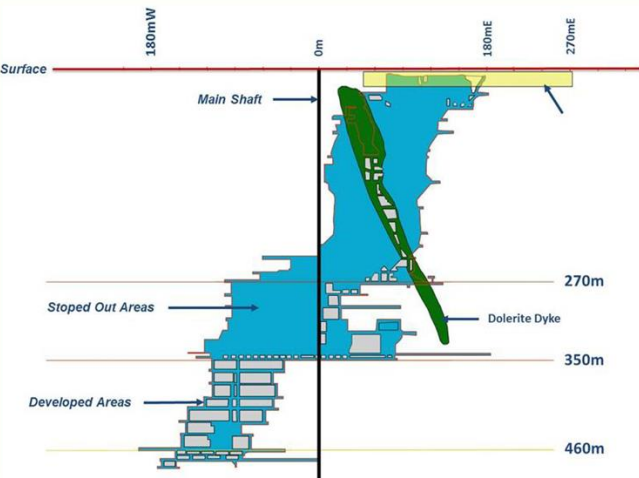
Vertical projection showing the extent of historical underground and mining development.
| Corner | Latitude | Longitude |
| 1 | 01 degrees 46 minutes 8.00 seconds | 33 degrees 49 minutes 30.00 seconds |
| 2 | 01 degrees 46 minutes 8.00 seconds | 33 degrees 51 minutes 30.00 seconds |
| 3 | 01 degrees 47 minutes 20.00 seconds | 33 degrees 51 minutes 30.00 seconds |
| 4 | 01 degrees 47 minutes 20.00 seconds | 33 degrees 49 minutes 30.00 seconds |
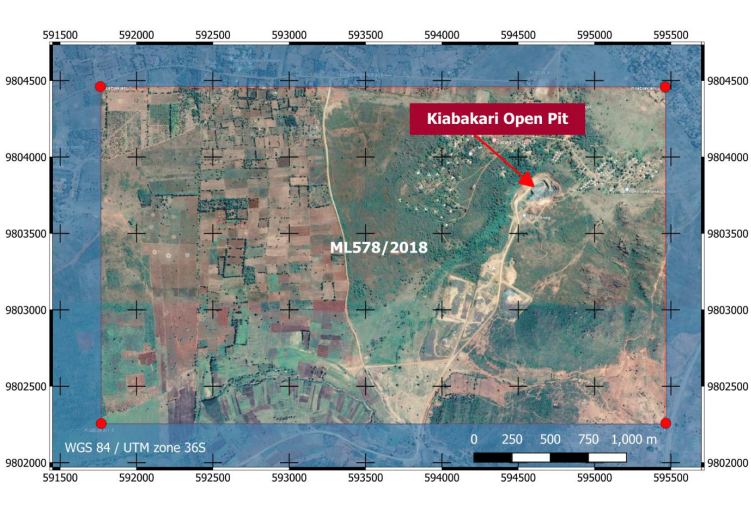
Satellite image showing the extent of mining permit ML578/2018 in relation to current open pit operations at the Kibakari mine and deposit.
Geological and mineralization setting
The Kibakari mine is located in the Musoma-Mara Greenstone Belt in northern Tanzania, approximately 30 km south of Musoma. The Musoma-Mara Greenstone Belt comprises a broad band of metavolcanic and metasedimentary rocks up to 30 km wide that are folded around an east-west fold axis. The Musoma-Mara Greenstone Belt is cut by two major ESE-trending shear zones, the Mara Shear Zone to the north and the Suguti Shear Zone to the south. Several minor ENE-trending shear zones also cut the belt. The Musoma-Mara Greenstone Belt also hosts several gold deposits, including the Mara North Gold Mine owned by Twiga Minerals, a joint venture between Barrick Gold and the Tanzanian government.
The stratigraphy of the mine from north to south consists of a striking, sub-vertical EW sequence of photoval metabasalt, graphitic schist, mylonite shear zone, metagabbro mine, hanging wall metabasalt, interfluve metasediments and late granites. The grade of metamorphism is upper greenschist to lower amphibolite. The mineralization transgresses lithological boundaries and appears to be structurally controlled, related to ENE-trending shears.
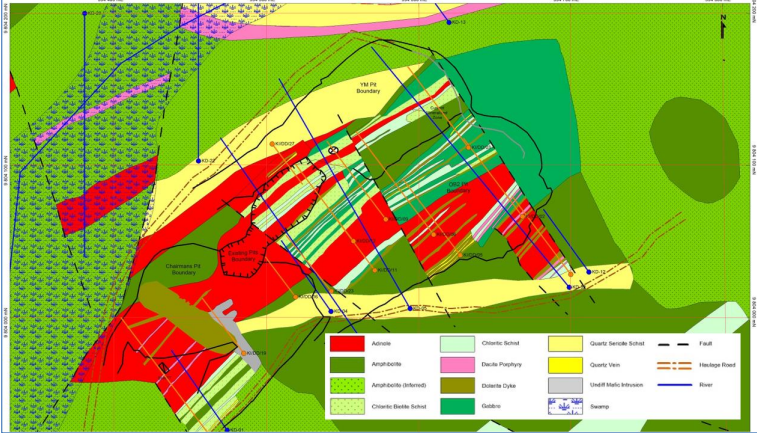 Geological map of the local mine – plan view
Mineralization is restricted to the steeply dipping ores, where the axial plane of a subvertical fold-package cuts an intrusive gabbro. This axial plane was later activated as a sinistral shear zone. Mineralization consists of a subvertical, widespread tabular body composed primarily of adinol (highly altered quartz albite representing a sheared and altered metagabro). Disseminated sulfides are present in small amounts (<7%) and include pyrite and pyrrhotite with minor arsenopyrite, the proportions of which vary from mineral to mineral. Similar to Big Bell in Australia (2.6Moz) and Hemlo in Canada (2Moz). Gold mineralization appears to be related to lithology (gabbro), structural deformation (highly sheared rock), sulfide type (pyrite > pyrrhotite), and intensity (more pyrite and pyrrhotite). The gold is generally free and can be recovered by cyanidation without roasting or flotation. Four major ore bodies are currently mined through open cast operations.
Mineral resource estimation
- Data
This estimate primarily uses drill data from the Goldfields and CATA campaigns, the former dominating the deep south-west and the latter the upper and north-east areas. These datasets are comparable and were combined for the MRE. Placer and Randgold drill data were not included as they are outside the current resource area.
- Domain modeling
The mineral domain for the MRE was defined using Seequent Leapfrog® software and an index value of 1g/t from 2m composite of CATA and Goldfields data. The orientation of the ore (70° dip to 225° dip) was taken into account in defining the wireframes for the geological model.
- Variography
To assess the spatial distribution of mineralization, semivariograms were generated in three directions. The variograms show a patch effect of about 40% and the dip direction (70° to 225°) has a long range of about 80 m, while the transverse variogram defines a range of about 30 m, which is consistent with the historical mineralization thickness.
- Block model and score estimation
The block model for MRE was developed using Seequent Leapfrog software, which has subblocks to better represent the shape and thickness of mineral veins.
Technical Appendix
- Sampling techniques
Sampling techniques used in this study included diamond core drilling, RAB drilling (GC) and reverse circulation drilling (RC). Samples were taken mainly at 1-1.5 m intervals. Mineralization was initially recorded through visual coring and chip logging and later confirmed using analytical methods such as bottle roll cyanide leaching and fire assay. All sampling tools and methods were calibrated to ensure representativeness and accuracy, particularly in relation to the mineralization under investigation.
- Drilling techniques
Drilling techniques used in this study include diamond coring, reverse circulation (RC) and RAB (grade control sampling). Trenching has been used historically but is not part of the current mineral resource estimate. Further details about the drilling process, such as core diameter, pipe type (triple or standard), depth of diamond tails, and whether the core is directional, are included where possible.
- Drill sample recovery
Drill core and chip sample recovery is recorded and evaluated to ensure high quality results. Measures are taken to maximize sample recovery and ensure that samples are representative. Recovery rates are typically greater than 95% in fresh material. There is no record of historical drilling in highly oxidized areas, but this is not important for the current estimate. A relationship between sample recovery and grade is controlled to avoid potential sample bias due to preferential loss or gain of fine/coarse material.
- Login
Core and chip samples are recorded both geologically and geotechnically at a level of detail that supports accurate mineral resource estimates, mineral studies, and metallurgical studies. Logging is both qualitative and quantitative. Core and chip samples are photographed (e.g., core, cut, channel samples). The total length and percentage of relevant intersections recorded are recorded. Holes are recorded from surface to end of hole (EOH) for the following:
- Petrology
- Mineralogy (observation %)
- Basic Geotechnics (RQD)
- Subsampling techniques and sample preparation
Sampling techniques used include sawing core samples in half, gun sampling for RC and RAB, and drying and crushing samples in situ. Quality control includes field replicates and retention of coarse traces for repeat analysis. Although gold grain size analysis has not been performed, past results do not indicate coarse gold issues and sample sizes are considered appropriate.
- Quality of measurement data and laboratory tests
Samples are primarily assayed in the CATA on-site laboratory using cyanide leach, which provides a detailed analysis. Statistical analyses of approximately 1,200 samples from CATA Phase 1 diamond drilling showed a significant correlation between the cyanide leach (CN) and Fire Assay (FA) methods with an r2 value of 0.78. Although FA tends to indicate slightly higher grades than CN, the results indicate that the differences are not significant enough to affect grade estimates. QAQC methods include blanks, certified reference materials (CRMs), and pulp replicates, with recommendations for more extensive testing of field and analytical replicates.
Sampling and measurement confirmation
Significant intersections have been visually verified by mine staff, and historical drill results were reviewed by independent consultants in 2016. Original photographs were cross-referenced with the survey sheets and drill database. While no twin holes were drilled, extensive in-pit exploration and drilling provided high coverage control down to less than 10 m in the current pit area and up to 30 m below the pit base. All drill sampling and exploration data are entered into an Access electronic database and the original data is recorded on physical report sheets before being transferred to the electronic system. These original report sheets are retained for future verification. No adjustments to the survey data presented in the current report were deemed necessary.
- Location of data points
The mine uses the ARC 1960 UTM Zone 37S (EPSG:21037) coordinate system for all location and collar readings. The mine boundary, pit locations and selected drill collars have been verified using satellite imagery and confirmed to be consistent with the provided coordinates. Topographic surveys of the open pit are updated monthly through total station surveys, using fixed survey points to ensure accuracy and consistency.
- Spacing and distribution of data
CATA grade control drilling is being carried out in the current pit at 5-10m intervals with RC drilling at 20m intervals and 5-10m intervals along the lines. Deep diamond core drilling is being carried out along the southern pit boundary at 50m intervals. Goldfields drilling is consistent with CATA drilling with additional vertical holes in the centre of the deposit. For the current mineral resource, drilling data was combined at 2m intervals based on the length of historical samples and the extensive nature and controlled lithology of the mineralisation.
- Data orientation in relation to geological structure
The sample orientation has been carefully planned to avoid bias. The deposit dips sharply to the southwest and strikes to the northeast. The mineralization is assumed to dip almost vertically. Surface drilling has been inclined and underground drilling has been carried out horizontally to achieve optimal intersection angles with the mineralization. Based on the available drilling data, no sampling bias is observed.
- Sample security
Sample security was not specifically assessed in the current review, but general comments on QAQC procedures highlight improved control over sampling and more rigorous verification checks on a regular basis.
Audit or review
The author conducted a review of the CRM standards used by the mine and obtained the original certifications from the CRM manufacturer. Based on the review, the author recommends implementing additional QAQC procedures to supplement existing procedures.
- Mineral lease and land ownership status
The current mining license (ML578/2018) is held by Kata Mining Company Limited under the Tanzanian Ministry of Minerals. The license is valid until 4 October 2028 and allows for mining and exploration throughout the license area. There are no known material issues with third party interests and no known impediments to the renewal of the license if required.
- Exploration conducted by other parties
Exploration by Goldfields, Placer Dome and Randgold has contributed to the current resource estimate. Randgold and Placer Dome focused on exploration of developments around the licence, but their data were not used in the current estimate. Goldfields’ underground and surface drilling overlaps to a large extent with CATA drilling and the two datasets were combined after statistical validation. However, the Goldfields data lacks QAQC, which is flagged as a concern, and this is why the deeper resource sections are classified as inferred, relying on historical data.
- Geology
Mineralization is restricted to steeply dipping ores where the axial plane of a subvertical fold pack cuts an intrusive gabbro. This axial plane was later activated as a sinistral shear zone. While structurally controlled, mineralization is also preferentially confined within the gabbro units. Mineralization consists of a massive, diffuse, subvertical tabular body composed primarily of adinol (highly altered quartz-albite, representative of sheared and altered meta-gabbro). Disseminated sulfides are present in small amounts (<7%) and include pyrite, pyrrhotite, and minor arsenopyrite.
Drill hole information
Drilling angles vary, most are vertical (RAB) or inclined between 55 and 90 degrees, generally targeting a northwest azimuth to intercept the mineral range. Drilling depths for core drilling in Kata and Goldfields are between 140 and 250 metres, with a total of 10,300 metres of diamond core drilling. The average RAB drilling in Kata is 18 metres and the average RC drilling is 41 metres. The average underground drilling in Goldfields is 24 metres, with a total of approximately 7,000 metres.
- Data collection methods
The composite was performed using 2 m weight composites, with spacings shorter than 40 cm in combination with the previous composite. Data slicing was applied after the composite, with the Goldfield diamond data slicing at 30 g/t to reduce variance and aligning it with the CATA data for better statistical accuracy. No metal equivalents were used.
- Relationship between mineralization width and section length
In most diamond drilling, the hole intersection angle was around 30 degrees, assuming vertical mineralization and holes dipping at 55-65 degrees. Although not ideal, the extensive nature of the mineralization process means that these samples are suitable for resource estimation. 7000 meters of underground horizontal drilling intersecting the mineral body at approximately 90 degrees further supports the reliability of the data.
- Charts
Appropriately scaled drawings and sections, including plan views of the drill hole collar location and sectional views, are provided in the main report.
- Balanced report
The report should include high and low scores to avoid misleading results.
- Other basic exploration data
Other meaningful data (e.g., geological, geophysical, geochemical, metallurgical results) should be reported. At present, no additional exploration data have been reviewed, although bulk density data are limited and additional work is recommended.
- More work
Planned work includes impact testing and depth expansion near the operation, as well as additional drilling based on previous findings. Water sampling for underground exploration is also planned.
- Database integrity
Validation checks are performed to avoid errors due to transcription or keying. Errors found were corrected after verification against the original reports.
- Geological interpretation
- The geological model is based on surface mapping, drilling, and structural measurements.
- Confidence is high due to the model's alignment with underground stops and surface exposures.
- The Bayer dolerite dike that cuts the mineralization has been excluded from the resource estimate.
- The geological interpretation is considered reliable and no major alternative interpretations affect the resource estimate.
- Dimensions
- The primary mineralized zone extends 1.3 km to the northeast and is continuous, while the secondary zone is less continuous to the northwest.
- The mineralization has variable thickness and depth, and the primary zone continues at depth.
- The modeling is based on surface mapping and drilling, with the initial process well defined.
- Estimation and modeling techniques
The estimate was based on a 1g/t index model generated using Leapfrog® software, with search parameters defined by the drill data. The block size is 4m x 8m x 4m, with interpolation using ordinary kriging. The resulting model was validated by fitting to monthly production data (97% agreement). No by-product recovery or deleterious element estimates were considered and the geological interpretation was consistent with historical mining areas. Data cut-off (30g/t for high-grade values) ensures statistical balance.
- Humidity
Tonnes are estimated in dry terms using bulk density methods.
- Cutting parameters
The cut-off grade used for open pit mining is 1 gram per tonne, based on grade control drilling and the current ore/waste definition.
- Mining factors or assumptions
Mining is currently carried out via an open pit above a historic underground stope. Stopes are located at the base of the pit and help define the shape and dimensions of the orebody. Drilling is being carried out using drill and blast methods, with close-spaced RAB drilling for grade control, supplemented by shallow RC drilling for long-term planning. The orebody is relatively widespread (~30 m) and grade control is used primarily to define the orebody boundary, with petrological control helping to define the overall shape of the orebody.
- Metallurgical factors or assumptions
The metallurgical recovery process was not investigated in detail, except to note that the mine is currently in production and the process plant is operating at nominal rates. The 88% recovery factor applied in the matching calculations demonstrates a high level of correlation with the block model and provides confidence in the current recovery estimates.
- Environmental factors or assumptions
The mine operates under an approved permit granted by the Tanzanian government, complying with all environmental regulations regarding waste disposal and environmental impacts. Regular government inspections are carried out, and while a detailed review of environmental and social impacts was beyond the scope of the report, the mine’s footprint is relatively small and there is room for expansion within the mining permit.
- Bulk density
The bulk density is assumed to be based on the host lithology and the fresh nature of the majority of the deposit. The density value used is 2.8 t/m3, reflecting the properties of the host gabbro, which is likely to have been influenced by the intrusion of mafic materials. This density assumption is considered appropriate for the current deposit conditions.
- Classification
English Summary: Mineral resources were classified based on data density, sample spacing and the quality of regression results from kriging. Open and near-surface areas, up to 200 metres below the topographic surface, were classified as “indicated” due to good data density from CATA and Goldfields. Some smaller, outlying mineralized areas were excluded from this category due to inadequate drill coverage. Below 200 metres, the resource was classified as “inferred” due to significantly lower sample density, largely based on historical Goldfields data. The competent person believes that further exploration and underground access will improve confidence in the deeper estimates.
- Discussion about relative accuracy/confidence
The accuracy and relative confidence in the mineral resource estimate was assessed using historical mine surface surveys and matched to production records from 2020 to 2022. and a production cut-off grade (COG) of 1 g/t. The matching results showed a high correlation with an average agreement of 97% between the block model and actual production. This indicates strong confidence in the accuracy of the mineral resource estimate and the block model is considered a reliable predictor of future gold production.
Conclusion
Kiabakari gold mining projects offer an unparalleled opportunity to invest in high-grade resources in one of the most resource-rich regions for gold mining in Africa. With scalable operations, proven reserves, and a supportive regulatory framework, these ventures promise exceptional returns and long-term growth potential.
Contact us today to explore how you can be a part of the success story in gold mining in Tanzania!
| Contact us for more information about this project and personal investment advice in Tanzania. Our team of experts are here to provide insights and detailed guidance to help you make informed investment decisions . | +989928374806 : whatsapp info@hamongostarsepanta.ir |
| Specialized information and local contact numbers | Click Here |
Fateme Shakeri